 Exceptionally detailed maps of child growth and education across Africa suggest that no single country is set to end childhood malnutrition by 2030.
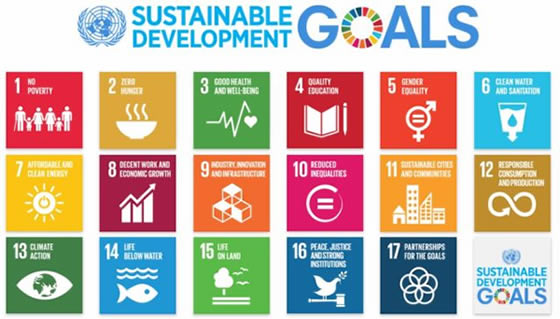
That target was set by the UN as a Sustainable Development Goal.
However, the new maps, which give detail to the level of an individual village, show that almost every nation has at least one region where children’s health is improving.
They are published in Nature.
The two studies have mapped child growth rates and educational attainment for women of reproductive age – tracking progress in both in 51 countries between 2000 and 2015. The scientists targeted these two factors in particular because they are important predictors of child mortality.
“Together, these are very useful indicators of where populations are doing well and where they’re being left behind,” explained Prof Simon Hay, a global health researcher from the University of Washington in the US.
Prof Hay and his team pieced together data from community-level surveys and produced a series of 5km by 5km scale maps, showing child growth and educational attainment across Africa over the 15-year span of the study.
‘Stark disparities’
This revealed that most African countries, especially much of sub-Saharan Africa and eastern and southern regions, show improvement in malnutrition.
They also showed large disparities within individual countries. But by mapping these in such detail, scientists say policymakers will have the evidence to direct their resources.
Kofi Annan, Nobel Peace Prize laureate and former secretary general of the UN, endorsed this aim in an article he wrote in response to the maps’ publication. “Without good data,” he wrote, “we’re flying blind. If you can’t see it, you can’t solve it.”

While highlighting what he called “stark disparities” in progress, particularly in conflict-affected areas, Mr Annan said the progress in Africa that these maps painted was “astonishing”.
“Especially for me,” he said, “an African accustomed to international headlines depicting a continent consumed by war, famine and hunger. The Africa shown in these maps tells a different story – one of measurable, steady progress on issues long thought intractable.
“[But] there are villages where all children are too short for their age. Across most of the Sahel, a semi-arid swath of land from the Atlantic to the Red Sea, high rates of stunting persist, with no hint of improvement.
“Such fine-grained insight brings tremendous responsibility to act.”
Lessons to learn
Progress in Africa has never before been mapped in this level of detail and Prof Hay said that making the data openly available and providing “the best information we can” would help to direct resources towards the populations most in need.
“We can look at those communities that are doing particularly well and ask if there are lessons we can learn and apply elsewhere,” he told BBC News.
In a study that is considered to have been the birth of modern epidemiology in the 19th Century, the London physician John Snow mapped cholera cases in London – revealing in a world-changing map how cases in the city were clustered around one water pump in Broad Street. This led to the revelation that the disease was spread through contaminated water.
Mr Annan concluded that these maps could be as powerful in the long battle against hunger.
“They are another tool in our arsenal,” he said. “Alone, they won’t eradicate malnutrition but they will enable Africa’s leaders to act strategically.”
Source: BBC


